Dashboard
2 featuresLive vehicle status Live
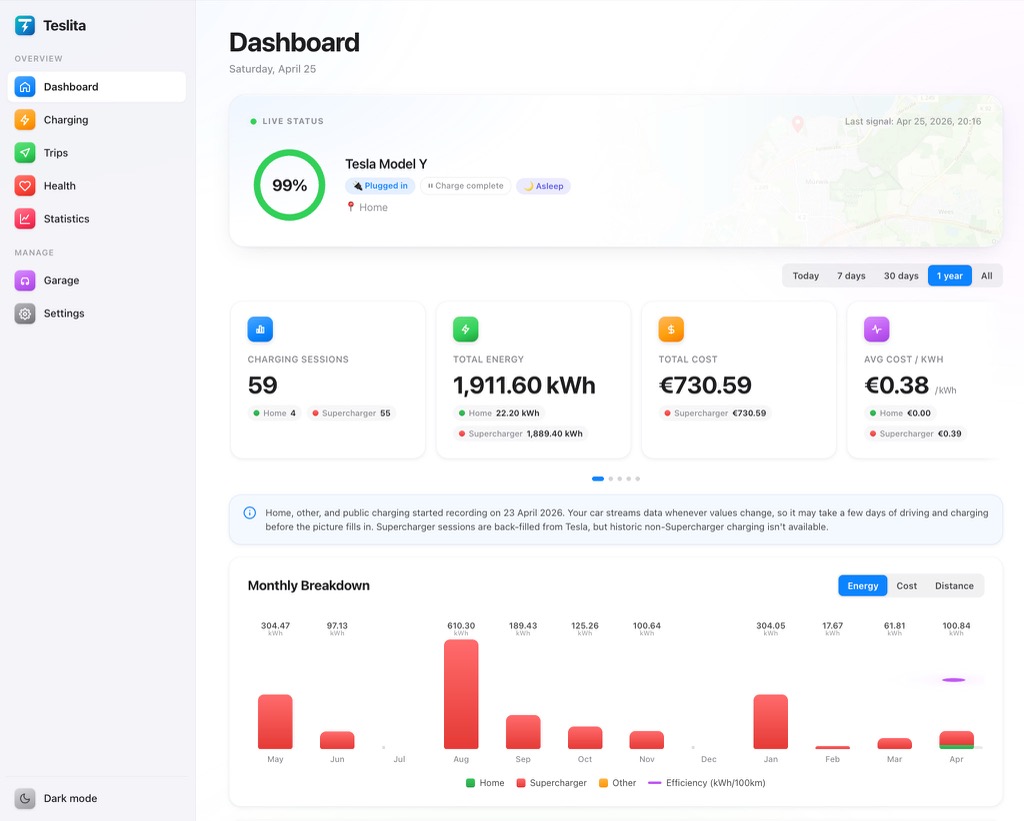
A live tile showing where the car is right now, whether it’s parked, driving or charging, and the current battery level. Updates continuously over a streaming connection, so you don’t have to refresh — values tick as the car moves or charges.
Monthly summary
Current-month totals for kilometres driven, kWh consumed and money spent on charging, all on the landing dashboard. A quick “where am I at this month” glance without opening a deeper view.
Trip log
7 featuresAutomatic capture Automatic
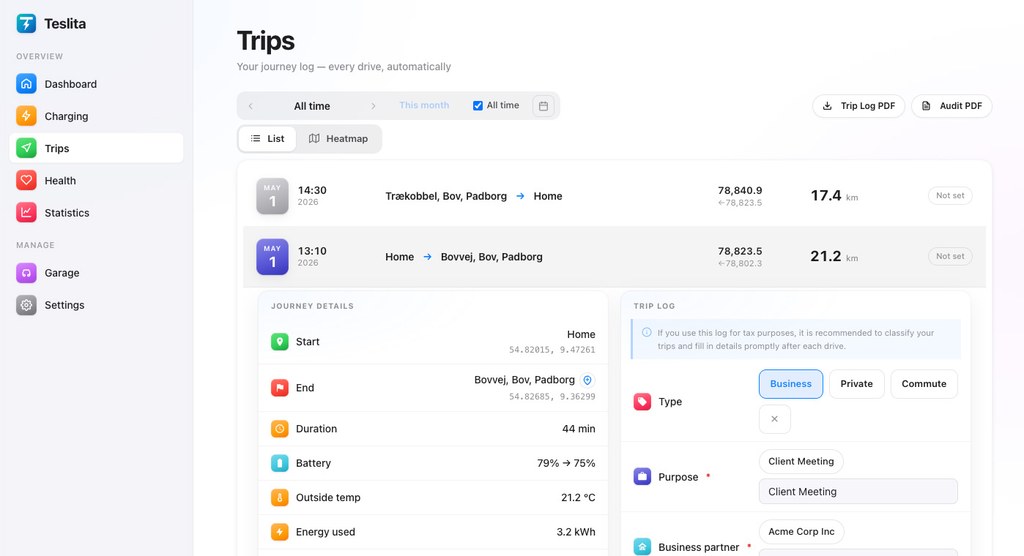
Every drive your car makes is recorded automatically from the car’s own gear, GPS and odometer signals — no app to open, no button to press. Start address, end address, route, distance and timestamp are filled in before you even park.
Classification
Each trip can be tagged as business, private or commute with a single tap. Useful for German Fahrtenbuch requirements and for anyone splitting personal-vs-work mileage for reimbursement.
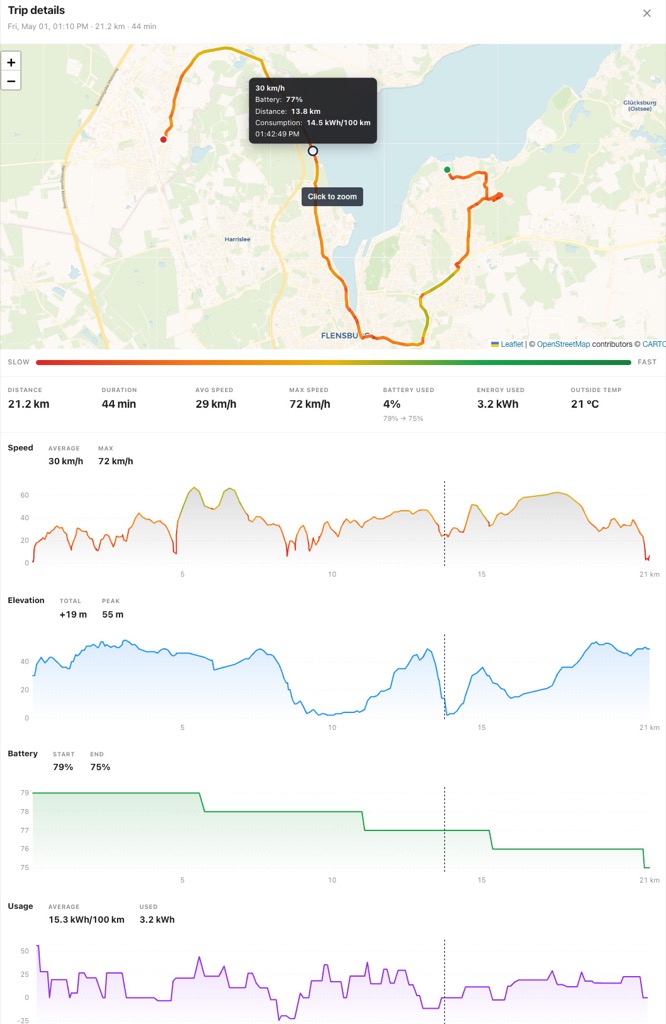
Waypoint replay
Open any trip and see the full route drawn on a map, minute by minute. Elevation and speed are plotted alongside, so you can see where you stopped, where you slowed down and how the drive actually went.
Live active-trip tile Live
While you’re driving, the dashboard shows a live tile with current speed, distance so far and an ETA based on your current destination. Updates in real time over the same telemetry stream.
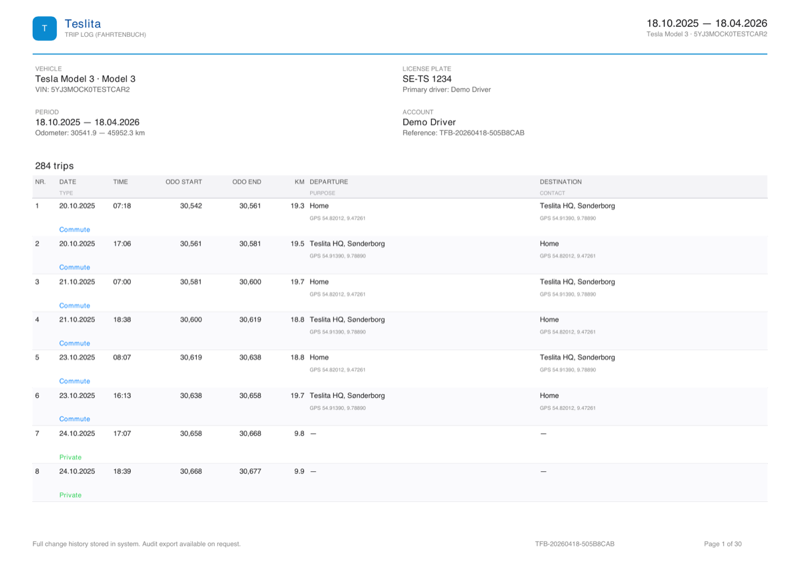
Signed monthly PDF Signed
Export a full Fahrtenbuch-style mileage log as a PDF. Each export is cryptographically signed with Teslita’s key so your accountant or tax auditor can verify it hasn’t been tampered with — right in any standard PDF reader.
Tamper-evident edit log
Every edit you make to a trip is linked by cryptographic hash to the one before it. A changed entry breaks the chain, and the break is visible in the signed export — so reviewers can trust that what they see is what was captured.
CSV export
If your accountant wants a spreadsheet rather than a PDF, you can export the full trip list as CSV. Date, start, end, distance, classification and notes all come through as columns.
Charging history
5 featuresPer-session detail
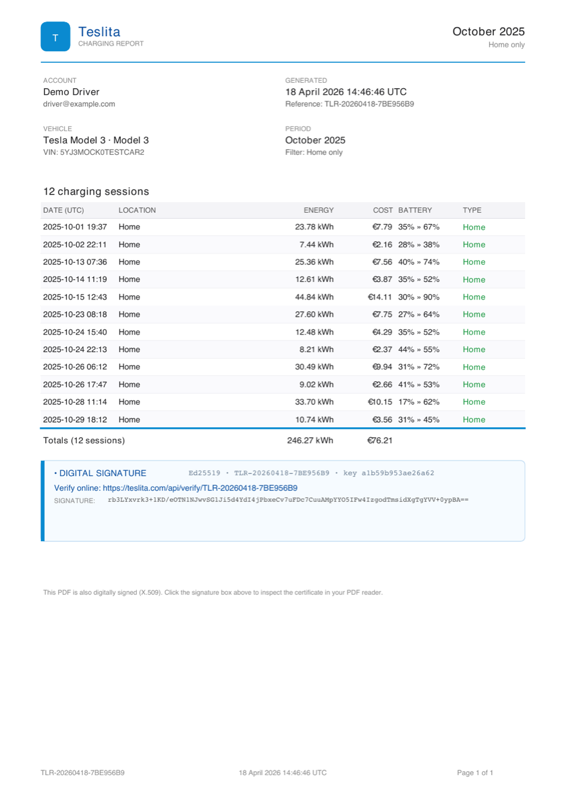
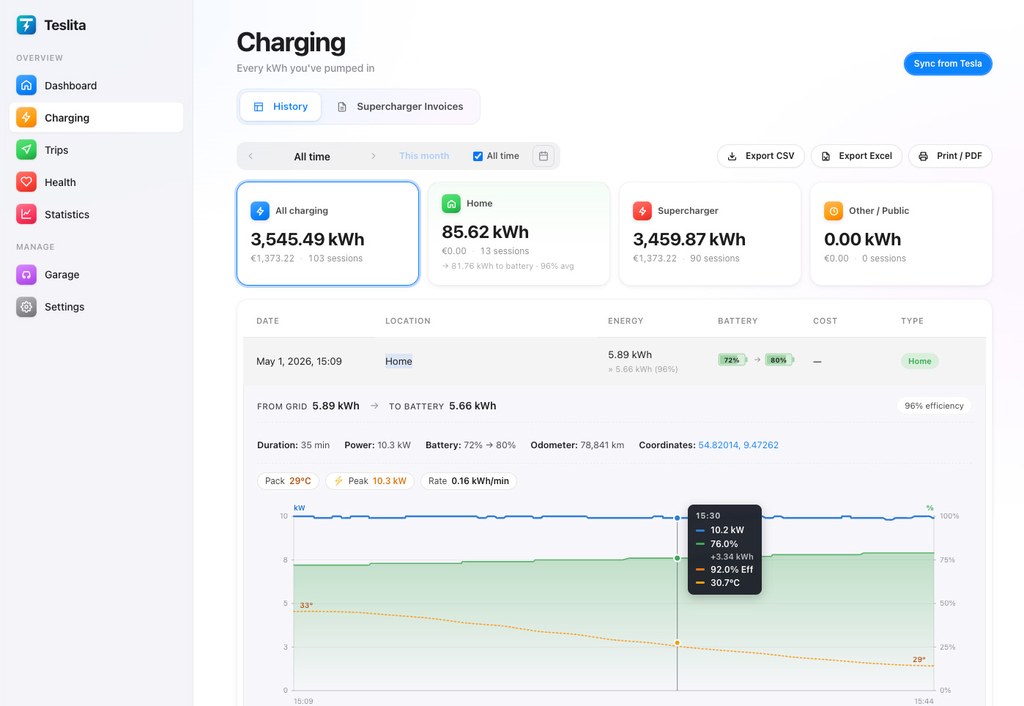
Every charging session your car has done, with date, location, duration, energy added and cost. You can filter by month or vehicle, and sort by any column. Home, Supercharger and other public sessions are all classified automatically.
Home-charging cost estimation
Enter your actual per-kWh electricity price once in Settings, and every home session gets a calculated cost from then on. The number is clearly labelled as estimated — Tesla doesn’t report a cost for home sessions itself.
Multi-currency support
If you charge in a country that bills in a different currency, Teslita converts the cost to your preferred currency using the European Central Bank’s daily rate. The original amount is kept alongside for reference.
Monthly breakdown chart
A bar chart showing how much you spent and how much energy you added, grouped by month. Tap any bar to jump straight to that month’s sessions.
Background sync Automatic
New sessions from Tesla show up without you doing anything — Teslita pulls them in automatically every ten minutes. A manual “Sync from Tesla” button is there if you want to force it.
Charging insights
4 featuresCharge curves
Your last ten DC fast-charging sessions overlaid on one kW-vs-battery-% chart. Lets you see how the taper compares across different Supercharger sites or temperatures, and whether a session ramped as fast as you’d expect.
AC charging losses
The difference between grid-side kWh and the kWh that actually ended up in your battery — the losses that heat your cables and on-board charger. A median figure across all your AC sessions plus a per-session breakdown.
Time to 80 %
How long a typical Supercharger stop takes for your car, from plug-in to 80 % battery. Shown as a median across qualifying sessions, so you can plan road-trip stops with real data, not marketing numbers.
Supercharger speed leaderboard
Every site you’ve charged at, ranked by the peak kW you actually pulled. A slow location usually means a hot pack, a shared stall or tired cabinet hardware — this chart makes bad stalls obvious.
Supercharger invoices
5 featuresPer-session PDF download
Every Supercharger session gets its official Tesla invoice as a PDF, one click away. These are the same invoices Tesla issues directly, pulled automatically into your account.
Bulk ZIP export
Grab every invoice in a date range as a single ZIP archive. Useful for end-of-quarter expense claims or handing a year’s worth of charging to your accountant in one file.
Automatic email delivery Automatic
Invoices can be emailed to you, your accountant and up to three other addresses automatically as Tesla issues them. You pick a preferred hour; the worker fires once a day in your local time.
Audit trail
Every download and every email is logged with a timestamp and who it went to. If an invoice ever needs to be proven sent, the audit row is there.
Status badges
Each invoice row shows “new”, “downloaded” or “emailed” chips so you can see at a glance which ones you’ve already handled and which still need attention.
Battery & pack health
6 featuresOverall health verdict
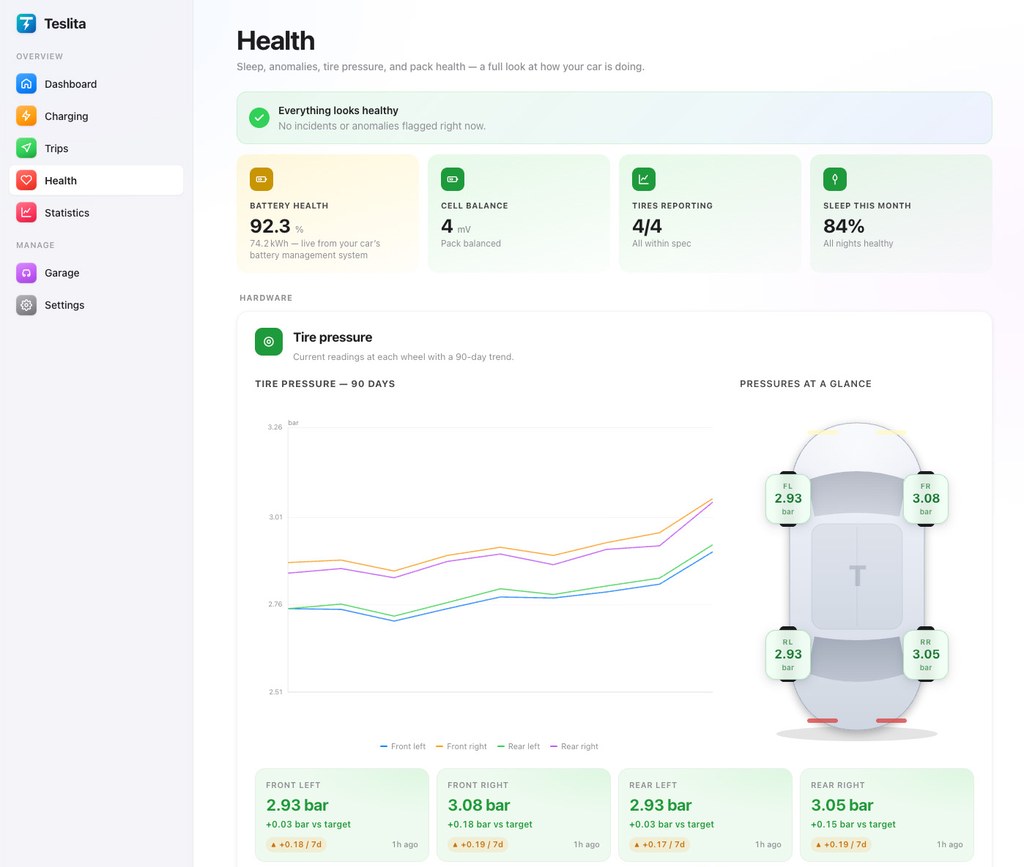
One headline line at the top of the Health page summarising every sub-signal: green when everything looks fine, amber when something’s drifting, red when a value is outside the healthy range. Saves you from reading ten charts to answer “is the car OK?”.
Cell imbalance
The millivolt spread between your strongest and weakest cell group. Healthy packs sit under 80 mV most of the time; a slow upward drift is normal with age. A 90-day trend line shows whether yours is stable or climbing.
Module temperature spread
The difference between your hottest and coldest pack modules at the same moment. Under 5 °C is a sign the cooling loop is balancing flow well across the pack; a widening spread can indicate a cooling problem worth investigating.
HV isolation resistance
The insulation between the high-voltage system and the chassis, measured in kΩ. Higher is better — a gradually falling value is a classic sign of moisture ingress and worth a service check.
Fault incidents (90 days)
A count of HVIL, BMS and inverter faults logged over the last quarter. Clicking through shows the exact events and when they happened, so you can bring a concrete list to a service visit instead of a vague feeling.
Live system-state chips Live
Small coloured chips showing the current state of the high-voltage interlock loop, the battery management system and the four drive inverters. Green means running normally, red means an active fault worth looking at.
Tire pressure
4 featuresTop-down car view
A Tesla-style top-down silhouette of your car with the current pressure at each wheel overlaid. Each reading is colour-coded against the 2.9 bar spec — green within 0.3 bar, amber within 0.5, red beyond — so out-of-spec wheels jump out immediately.
Slow-leak detection
A 14-day sliding slope analysis for each wheel. If one wheel is losing air faster than the others, Teslita flags it as a suspected slow leak before the TPMS warning light would trigger.
90-day pressure trend
One line per wheel over the last three months so you can spot seasonal changes (pressure drops with cold weather) and separate them from real leaks.
Bar or PSI
Pressures can be shown in bar or PSI. Seeded from your car’s own GUI setting on first connect, and switchable anytime in Settings.
Sleep tracking
3 features30-day sleep timeline
One row per day, left-to-right representing midnight to midnight, coloured by what the car was doing — sleeping, idling online, driving or charging. Makes it obvious whether a car that “feels like it’s losing range” is actually staying awake all night.
Monthly sleep share
A single percentage summarising how much of the tracked time the car actually spent asleep versus staying online. A healthy value is usually well above 80 %; lower numbers point at something keeping the car awake.
Day-detail modal
Tap any day to see every transition: when the car woke, when a drive started, when it plugged in, when it went back to sleep. Each event is timestamped and, for drives and charges, linked to the full trip or session.
Anomaly detection
3 featuresPhantom drain
Any overnight battery loss that happens while the car is parked (no driving, no charging) is tracked and displayed as a chart. A few percent a day is normal; sharp spikes can indicate Sentry mode, cabin overheat protection or the car simply failing to sleep.
Unusually slow charging
A DC session where the peak kW fell well below the same site’s baseline is flagged — often the sign of a problem stall. Gives you something concrete to report to Tesla or avoid next time.
Unusually bad efficiency
Trips that used more than 25 % more energy than expected for their average speed and temperature. Common explanations: low tire pressure, a roof box, a dragging brake — all worth checking.
Statistics — deep dives
9 featuresLifetime efficiency
Your weighted average kWh per 100 km across every trip, plus a monthly trend so you can see the winter bump and summer dip. Also breaks out the cold-weather penalty and highway penalty as explicit numbers.
Efficiency vs temperature
A scatter plot where every dot is one trip, X is the outside temperature, Y is the trip’s kWh per 100 km. A dashed personal trend line makes the winter hit on range obvious at a glance.
Efficiency vs speed
Same idea but plotted against the trip’s average speed. City drives cluster on the left, motorway runs on the right — you can see exactly where your car’s efficiency sweet spot is.
Places visited
A density-heat map of every waypoint your car has recorded, plus a ranked list of your top destinations and an automatically-detected commute pattern. Shows where your car actually spends its life.
Firmware timeline
Every firmware version your car has reported, with the dates it was running on each. Makes release-date proof easy and lets you line up efficiency changes with firmware updates.
Firmware impact
Compares efficiency, sleep and drain before and after each firmware update. Needs at least a week on each side; once populated, it shows whether Tesla’s last update actually changed anything measurable on your car.
Regenerative braking ratio
The share of drive energy your car has recovered via regen over its lifetime. A single ratio plus the underlying kWh figures, for anyone curious how much of their range comes back from braking.
Driver-assist usage
Cumulative distance driven with Autopilot or FSD engaged. Picks up from the car’s own counter so it survives Teslita setup and reflects your real usage.
Teslita Wrapped
A single year-in-review card summarising distance, energy, cost, CO₂ saved, trees-equivalent, Supercharger stops and the longest drive of the year. Shareable screenshot-friendly layout.
Multi-car garage
4 featuresEvery car on your Tesla account
Teslita tracks each vehicle independently. Trips, charging, stats and health are all scoped to the currently-selected car, so a family with two Teslas can see each one’s history cleanly separated.
Custom nicknames
Name each car whatever you like — the nickname shows in the header and picker so you can always tell which vehicle’s data you’re looking at.
Automatic archiving
If a car disappears from your Tesla account (sold, traded in), Teslita doesn’t delete the data — it archives the car. All of its history stays readable under the new owner’s account, just marked as disconnected.
Swipe to switch
On mobile, swipe left or right on the car name in the header to cycle between your active vehicles. Dots below show which car is currently selected.
Settings & preferences
6 featuresHome location
Set where “home” is by searching for an address, using your phone’s GPS, or pulling the car’s last-known parked position. Charging sessions within the radius you pick get classified as “home” automatically.
Units you read the car in
Separate preferences for distance, temperature (°C / °F / auto-by-country) and tire pressure (bar / PSI). Teslita picks sensible defaults from your language and your car’s own setting, but you can override at any time.
Number formatting follows your language
An English account sees “11.12”; a German or French one sees “11,12”. Same for thousands separators, currencies and dates — everything uses your UI language’s conventions.
15 supported languages
English, German, French, Spanish, Portuguese, Italian, Dutch, Swedish, Norwegian, Danish, Finnish, Polish, Japanese, Chinese and Korean. Switch any time; the invoice email you receive will arrive in the same language.
Data & privacy panel
Shows exactly which Tesla OAuth scopes your account has granted, when the last telemetry signal arrived, and the fingerprint of the key Teslita uses to sign your reports. No hidden state.
Full account erasure
One confirmation (type your email) removes your Teslita account, every trip and charging record, and revokes the Tesla OAuth token so Teslita is removed from your Tesla account too.
Signed exports
4 featuresTrip PDF Signed
A full Fahrtenbuch-style mileage log you can hand to an accountant or tax authority. Every page is signed with Teslita’s ECDSA key so the reviewer can verify authenticity in any PDF reader without special software.
Home-charging statement Signed
A signed monthly PDF showing every home-charging session with kWh added and derived cost. Suitable for submitting to an employer or tax authority for electricity reimbursement.
Public verification endpoint
Teslita publishes the public half of its signing key at a stable URL. Anyone handed a signed PDF — your accountant, your HR department, the tax auditor — can fetch it and independently verify the signature.
CSV exports
Trips and charging sessions can also be exported as CSV for spreadsheets and external tools. Same data as the PDFs, just machine-readable.